
Steven Woolf

No, COVID statistics don’t look bad because the US does too much testing or because hospitals are attributing too many deaths to COVID

As I mentioned before, although I enjoy a good wager, my maximum bet is normally $1. Last week, my brother-in-law, the owner, operator and namesake of a popular restaurant, offered to bet a bottle of wine that the reason the COVID-19 statistics look bad in the US is because of high rates of testing and
No, COVID statistics don’t look bad because the US does too much testing or because hospitals are attributing too many deaths to COVID Read More »

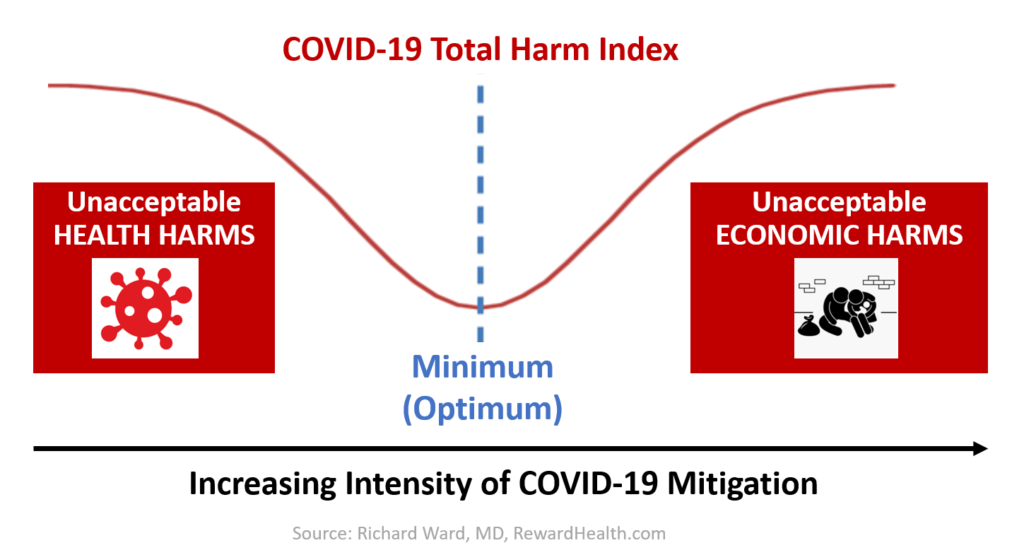
Graph labelled "COVID-19" Total Harm Index, showing optimization curve with minimum harm at a middle level of intensity of COVID-19 mitigation.

Introducing the Harm Index Minimization Strategy for COVID-19 pandemic response: Better than Flatten the Curve, Crush the Curve and Hammer and Dance strategies

In my last post, I described three helpful analogies — Forest Fire, Genie in the Bottle, and Trucker in the Mountains — that make it easier for leaders to wrap their heads around different COVID-19 pandemic response strategies. In this post, I will use those analogies to explain six COVID strategies: Then, I will explain

Introducing the Harm Index Minimization Strategy for COVID-19 pandemic response: Better than Flatten the Curve, Crush the Curve and Hammer and Dance strategies Read More »